 HistogramIQ
Proven trading signals powered by the Elder Method — a trusted strategy used by thousands of traders. See your charts clearly, trade with precision.
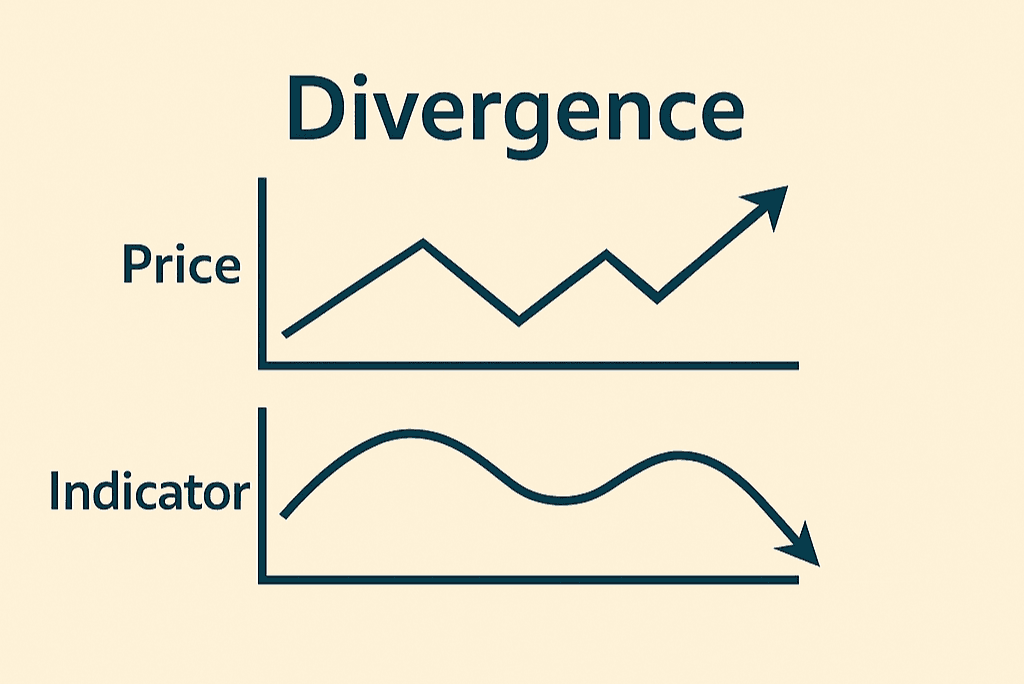
What is a market divergence?
Imagine you're watching someone running along the beach. At first, everything looks fine. But then, even though they insist they're still running fast, you notice their steps getting slower. That’s when you realize something isn’t quite right.
In trading, that's a divergence:
- ✔️ The price goes up, but the 'pace' (measured by indicators like the MACD) weakens.
- ✔️ It’s like saying: 'It looks strong, but it’s actually getting tired.'
- ✔️ So, it’s a sign the direction might change soon.
And what’s the point of using three timeframes?
Imagine you’re looking at the ocean to decide whether to go fishing.
- 1️⃣ First, you check the day’s weather (how the whole day will be). That’s the long-term chart. It tells you if a storm is coming or if the sea will be calm all day.
- In trading, this shows whether the overall market is trending up or down.
- 2️⃣ Then you check the weather for the next few hours. That’s the medium-term chart. It helps you decide if it’s a good time to get the boat ready.
- This shows when it might be a good moment to buy or sell.
- 3️⃣ Finally, you look at how the waves are right now. That’s the short-term chart. It helps you get in or out with more precision.
- It helps you choose the exact moment to enter or exit the market.

In summary
Divergence
Noticing that something doesn’t add up: the price looks strong, but the indicators show it’s losing strength.
Three timeframes
Using three timeframes gives you context, direction, and precision to make safer decisions.
Ready to gain an edge in the market?
Let the specialized software detect hidden opportunities for you — it identifies powerful divergences automatically.
Skip the noise. The specialized software scans and analyzes long‑ and mid‑term charts so you don’t have to.
When everything aligns, you receive a clear, timely alert in the chatbot — and execute trades directly when available.
What You Will Get
- ✔️ Configure your strategy easily through the chatbot.
- ✔️ Market Scanner to spot opportunities and divergences.
- ✔️ Real-time monitoring of assets and timeframes.
- ✔️ Instant notifications to stay on top of the markets.
- ✔️ MT5 service for seamless integration.
- ✔️ Automated trade execution when enabled.
- ✔️ Wide coverage of assets and timeframes.
- ✔️ Full support with documentation and help portal.
⚠️ The information provided is for educational purposes only and does not constitute investment advice or personalized recommendations
Verified Results
Plans & Pricing
Free
$0/mo
Find entry opportunities with per-asset scan and alerts
Starter
$49/mo
Automate your entries — per-asset execution unlocked
Semi-ProComing
Soon
$89/mo
Find entry opportunities with multi-market scans and alerts
ProComing
Soon
$129/mo
Automate your entries — multi-market execution unlocked
Compare Plans
| Free | Starter | Semi-Pro | Pro | |
|---|---|---|---|---|
Configuration via chatbot | ✓ | ✓ | ✓ | ✓ |
Real time notifications | ✓ | ✓ | ✓ | ✓ |
Per-asset scanner (via MT5 Robot) | ✓ | ✓ | ✓ | ✓ |
Per-asset execution (via MT5 Robot) | — | ✓ | ✓ | ✓ |
Multi-market/asset scanner (via MT5 Service)Coming Soon | — | — | ✓ | ✓ |
Multi-market/asset execution (via MT5 Service)Coming Soon | — | — | — | ✓ |
Active accounts | 1 | 2 | 4 | Unlimited |
Support | Standard | Standard | Standard | Priority |
Frequently Asked Questions
Free: focused on per-asset opportunity detection and notifications via the MT5 Robot. Starter: adds automated execution per asset, combining opportunity detection and trade placement through the MT5 Robot. Semi-Pro: includes everything in Free and Starter, and unlocks multi-market/multi-asset scanning and notifications via the MT5 Service. Pro: includes all previous features and extends automation to multi-market/multi-asset execution using the MT5 Service.
No. This is an automation software subscription. We do not provide investment advice or signals.
Alerts work via the chatbot on any device. The Robot and Service runs on MetaTrader 5 (MT5).
Monthly or annual subscription in USD. No perpetual license.
Yes. Deactivate on one account and activate on another at any time.
Yes. You can cancel your subscription at any time. When you cancel, you keep access to your plan until the end of the current billing period. We do not offer refunds for partially used billing periods.
You need MetaTrader 5 (MT5) installed on a Windows machine or VPS, a supported broker account, and a stable internet connection.
No. The robot and service only place and manage trading orders inside your MT5 terminal according to your configuration. They cannot withdraw, transfer, or move funds from your broker account, and they do not store your broker password.
Alerts notify you about potential trading opportunities so you can decide whether to enter a trade manually. Automated execution uses the MT5 Robot or MT5 Service to place and manage trades automatically based on your rules, risk settings, and configuration.
Support is provided through the official channels. Response times may vary depending on plan level. We currently support English, Portuguese, and Spanish for most support requests.